


- bhavya gada
- No Comments
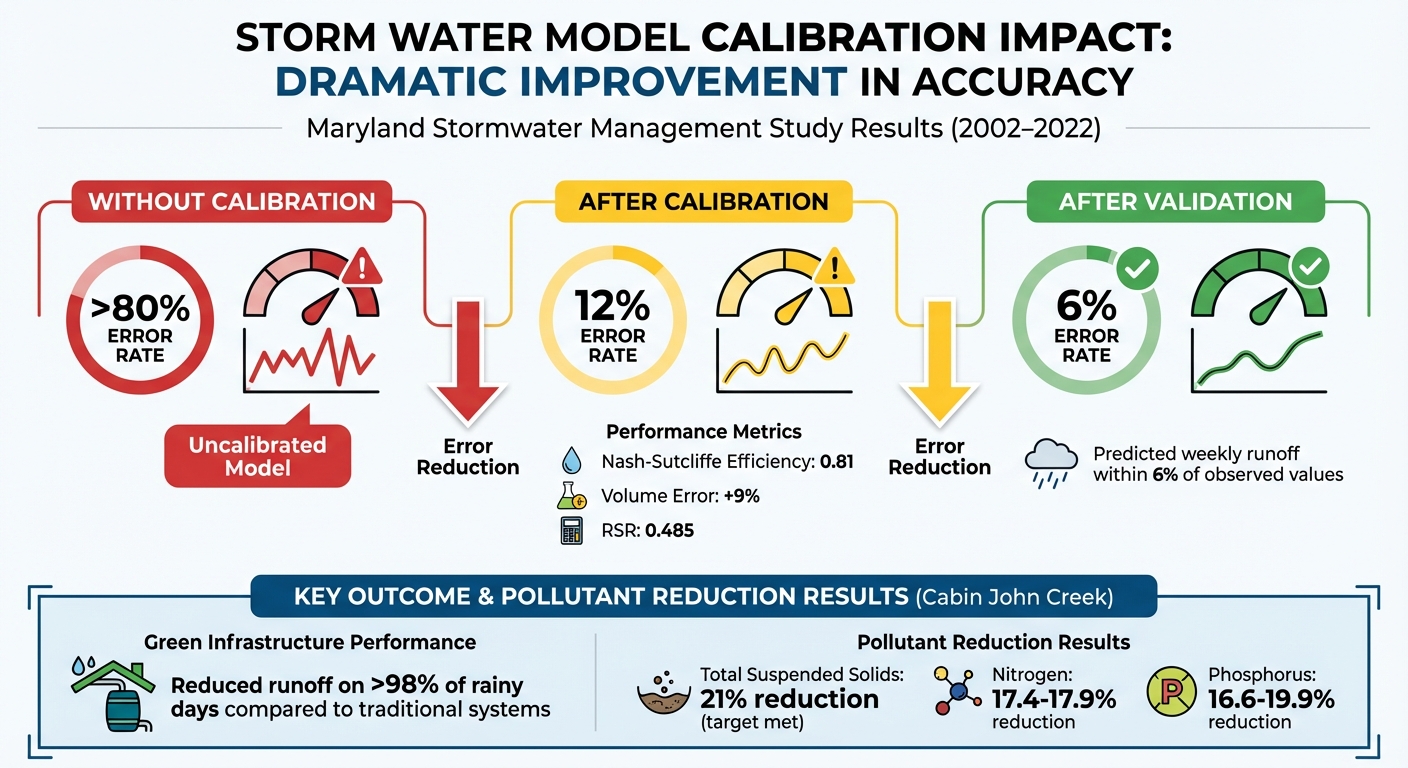
Stormwater models are critical for managing Maryland’s drainage systems, but their accuracy depends on proper calibration and validation. Without calibration, runoff predictions can be off by over 80%. Once calibrated, errors drop to 12%, and validation refines this further to just 6%. This ensures better compliance with Chesapeake Bay TMDL requirements, cost-effective planning, and preparation for increased runoff due to climate change.
Key takeaways:
- Validated models: Improve runoff predictions and meet regulatory targets for nitrogen, phosphorus, and sediment.
- Green infrastructure: Found to outperform traditional systems, reducing runoff on over 98% of rainy days.
- Modeling tools: WMOST and SWAT were used to simulate pollutants and assess stormwater solutions in Maryland’s urban and suburban watersheds.
- Challenges: Some limitations remain in simulating advanced infiltration systems like trenches.
These findings highlight the importance of data-driven approaches in stormwater management to address urban development and climate challenges effectively.
Impact of Model Calibration on Stormwater Runoff Prediction Accuracy
Study Area: Maryland’s Geography and Stormwater Challenges
Study Site Characteristics
The focus of the study is Maryland’s Piedmont region, an area known for its unique stormwater management issues [4]. Specifically, it examines the Clarksburg watersheds in Montgomery County and the urban Cabin John Creek watershed, a tributary of the Potomac River [1][2]. To provide a point of comparison, the study also includes forested control watersheds to assess the environmental impacts of development.
Soil types play a major role in how well stormwater infrastructure performs. Maryland classifies soils into two broad groups: A+B soils, which have high infiltration rates, and C+D soils, which are prone to low infiltration and high runoff. These classifications are critical for determining where infiltration-based solutions, such as bioretention systems and infiltration trenches, can be effectively implemented [2]. These soil characteristics are also essential for setting up and calibrating stormwater models.
The region’s topography changes significantly during construction, with noticeable impacts even in protected riparian zones, despite regulations designed to safeguard these areas [1]. Urban development introduces challenges like increased runoff, higher peak flow rates, and deteriorating stream health [1][2]. On top of this, climate change models predict heightened seasonal runoff during Maryland’s fall and winter months, adding another layer of complexity to stormwater management [4].
These varied physical and land-use factors set the stage for the detailed data collection and monitoring efforts described below.
Data Collection and Monitoring
From 2002 to 2022, the USGS conducted extensive monitoring across five Clarksburg watersheds, focusing on streamflow, water quality, geomorphology, and benthic macroinvertebrate communities to understand the long-term effects of suburban development [1]. The program used tools like tipping bucket rain gauges to measure precipitation and weirs or flow meters to track water inflow and outflow volumes [5].
Model calibration relied on Lidar-derived digital elevation models and detailed field observations. The monitoring program gathered data on flow measurements and a range of watershed health indicators, including water quality, physical stream conditions, and biological assessments [1]. This comprehensive approach revealed key findings: while distributed stormwater systems effectively reduced peak flows for smaller storms, sensitive benthic macroinvertebrate populations struggled to recover after development, and urban stressors led to increased specific conductance [1]. The detailed measurements collected were essential for improving the accuracy of model calibration and validation.
sbb-itb-843f8be
Stormwater Model Selection and Setup
Model Selection Criteria
Selecting the appropriate stormwater model for Maryland’s varied watersheds required addressing both regulatory demands and local environmental challenges. For the urbanized Cabin John Creek watershed, the US EPA opted for the Watershed Management Optimization Support Tool (WMOST v3). This tool is particularly effective for identifying cost-efficient management strategies in watersheds spanning 10,000 to 250,000 acres [2]. The model’s capability to simulate three key pollutants – Total Nitrogen (TN), Total Phosphorus (TP), and Total Suspended Solids (TSS) – was essential to meet the Chesapeake Bay Total Maximum Daily Load (TMDL) and Maryland’s non-tidal stream TMDL requirements [2].
In contrast, the Clarksburg area required a different approach. Researchers selected the Soil and Water Assessment Tool (SWAT) due to its strengths in evaluating distributed Low Impact Development (LID) practices under future climate scenarios [4]. This model was particularly suited to addressing complex hydrological concerns, such as infiltration-focused management, shifts in baseflow during construction, and the "urban stream syndrome" prevalent in Maryland’s developing watersheds [1][4]. Between 2011 and 2016, the University of Maryland team calibrated SWAT using daily streamflow data from the USGS. Their findings revealed that watersheds emphasizing green infrastructure (GI) experienced reduced runoff on over 98% of rainfall days compared to traditional management practices [4].
Once the models were selected, the focus shifted to configuring them to accurately reflect local conditions.
Model Configuration and Input Parameters
Adjusting the models to represent Maryland’s unique environmental characteristics required detailed, high-quality data. Pollutant loads were distributed based on soil groups A+B (high infiltration) and C+D (low infiltration), an essential factor for evaluating infiltration-based solutions as outlined in the Study Area section [2].
To account for changing topography during suburban development, researchers utilized LiDAR-derived digital elevation models from 2002, 2008, 2013, and 2018 [1][4]. These elevation models were paired with land cover data from the Chesapeake Conservancy to refine runoff coefficients and land use parameters [2][4]. Additionally, Maryland’s diverse rainfall patterns were incorporated into the models, which were tested against precipitation data from years like 2003 (above-average rainfall) and 2014 (an average year that included a 100-year storm event) [2].
Key factors such as saturated hydraulic conductivity, Manning’s n for swales, and initial soil moisture deficit were identified as the most sensitive inputs for accurately simulating suburban runoff [3]. Early simulations, which were uncalibrated, underestimated weekly runoff volumes and peak flow rates by over 80%. However, after calibration using automated tools like PEST, the models’ accuracy improved significantly, with predictions aligning within 12% of observed values [3]. The calibrated LID modules achieved an average Nash-Sutcliffe efficiency score of 0.81 and a volume error of just +9% [5].
This meticulous configuration process set the stage for the critical steps of calibration and validation.
Calibration and Validation Process
Calibration Methods and Results
The calibration process initially revealed a major issue: significant underpredictions, with errors exceeding 80% for Low Impact Development (LID) watersheds. Through calibration, these discrepancies were drastically reduced [3].
To tackle the problem, researchers used PEST (Parameter ESTimation) software. This tool employed a nonlinear, multi-event, and multi-objective calibration approach to fine-tune unmeasured hydrologic parameters. The focus was on the most sensitive variables, such as saturated hydraulic conductivity, Manning’s n for swales, and the initial soil moisture deficit [3][5]. PEST made iterative adjustments, refining these parameters until no further improvements in the model’s alignment with observed data could be achieved [5].
The results were impressive. Calibration reduced errors from over 80% to just 12%, achieving an average Nash–Sutcliffe Efficiency (NSE) of 0.81, a volume error of +9%, and an RSR (ratio of root mean square error to standard deviation) of 0.485 [3][5]. Michelle Platz from the Oak Ridge Institute for Science and Education highlighted the success:
"The calibrated LID modules’ Nash–Sutcliffe efficiencies averaged 0.81; average percent bias (PBIAS) −9%; average ratio of root mean square error to standard deviation of measured values 0.485; average index of agreement 0.94" [5].
However, challenges arose during the University of Maryland Bioswale study. Researchers used SWMM to calculate runoff from an upstream impermeable highway draining into the bioswale. PEST optimized parameters by comparing observed and calculated hydrographs [5]. Despite these efforts, David J. Rosa from the University of Connecticut noted:
"Results suggest either calibration is needed to improve predictions for LID watersheds or expanded look-up tables for Green–Ampt infiltration parameter values that account for compaction of urban soil and antecedent conditions are needed" [3].
While the bioswale study presented hurdles, these calibration efforts laid the groundwork for the validation phase, ensuring the model could reliably perform under a variety of conditions. After these refinements, the models were rigorously tested using independent storm events.
Validation Methods and Outcomes
Building on the calibrated parameters, the validation phase tested the model’s reliability using independent storm events. From 2011 to 2016, the USDA Soil and Water Assessment Tool (SWAT) was validated against USGS daily streamflow data collected in Clarksburg, Maryland. This ensured the model could handle seasonal variations and diverse rainfall patterns [4].
The validation phase delivered strong results. Predicted weekly runoff volumes for LID watersheds were within 6% of observed values [3]. The models accurately forecasted the timing of peak flows, although they underestimated peak magnitudes by 10% [5]. These outcomes met critical performance benchmarks: NSE above 0.5, an index of agreement (d) exceeding 0.75, PBIAS within ±15%, and RSR at or below 0.7 [5].
Despite these successes, one limitation became evident. Michelle Platz pointed out:
"We had more difficulty in calibrating one study, an infiltration trench, which identified a significant limitation of the current version of the SWMM LID module; it cannot simulate lateral exfiltration of water out of the storage layers" [5].
This limitation highlights the need for further development of the SWMM model to better simulate deep LID practices like infiltration trenches. These refinements are essential to improve accuracy and broaden the model’s application.
Applications for Maryland Stormwater Management
Benefits for Maryland Communities
Maryland communities facing drainage issues and strict regulations can benefit immediately from validated stormwater models. These tools help local managers pinpoint cost-effective methods to meet Chesapeake Bay TMDL targets for nitrogen, phosphorus, and sediment reduction.
In December 2019, the US EPA used the Watershed Management Optimization Support Tool (WMOST v3) to address stormwater challenges in Cabin John Creek, a heavily urbanized watershed. The goal was to achieve a 21% reduction in Total Suspended Solids (TSS). The modeling revealed that the most cost-effective solutions included infiltration basins, sand filters, and dry-to-wet pond conversions, all of which surpassed regulatory requirements [2].
Green infrastructure has proven to be more effective than centralized gray systems, reducing runoff during over 98% of rainfall days [4]. The US EPA emphasized this in their findings:
"Meeting sediment load reduction targets will require greater implementation of green infrastructure stormwater control measures, particularly those with enhanced infiltration" [2].
From 2011 to 2016, researchers used the USDA Soil and Water Assessment Tool (SWAT) to study Clarksburg, Maryland. By calibrating the model with USGS daily streamflow data, they confirmed that watersheds employing green infrastructure experienced reduced runoff compared to traditional methods on over 98% of rainy days, even under future climate scenarios [4]. These findings highlight the effectiveness of green infrastructure in comprehensive stormwater management.
Connection to Pro Landscapes MD Services

Pro Landscapes MD builds on these proven strategies to deliver customized stormwater management solutions. The research findings validate their expertise in applying enhanced infiltration measures, such as French drains, infiltration trenches, and precise grading. These services are central to their work in areas like Clarksburg, Montgomery County, and Howard County, ensuring effective stormwater solutions tailored to local needs.
Overview of Hydrologic Model Calibration
Conclusion
Research from Maryland highlights the importance of accurate stormwater model calibration. Without calibration, models can underestimate runoff by over 80%, but with proper adjustments, errors drop to just 12% [3]. This level of precision can mean the difference between effective planning and costly missteps.
Examples from Clarksburg and Cabin John Creek show how distributed green infrastructure can outperform traditional centralized systems. In Clarksburg, watersheds using green infrastructure generated less runoff than traditional management on more than 98% of rainy days [4]. Similarly, the Cabin John Creek study demonstrated that infiltration-focused strategies not only achieved a 21% sediment reduction target but also delivered nitrogen reductions of 17.4–17.9% and phosphorus reductions of 16.6–19.9%, exceeding Chesapeake Bay TMDL requirements [2].
Looking ahead, Maryland faces new challenges as climate change increases seasonal runoff. Communities must integrate these projections into their stormwater management plans. Validated models provide a strong foundation for adaptive strategies that can handle these shifts while meeting strict regulations. The findings suggest that green infrastructure with enhanced infiltration offers better resilience to climate impacts than traditional gray systems.
However, as Kristina G. Hopkins from USGS points out:
"More stormwater facilities distributed across the watershed is beneficial but cannot mitigate the effects of all urban stressors on aquatic ecosystems" [1].
Future efforts will need to monitor a range of factors – like water quality, geomorphology, and biological health – to ensure comprehensive watershed protection.
For Maryland property owners and managers, these findings emphasize the need for integrated, science-driven approaches to stormwater management. At Pro Landscapes MD, we apply advanced calibration techniques and infiltration-focused green infrastructure solutions to deliver sustainable, cost-effective results that help communities meet tough environmental standards.
FAQs
What data is required to calibrate and validate a stormwater model?
To fine-tune and confirm the accuracy of a stormwater model, you’ll need a mix of hydrological data – such as rainfall and runoff measurements – and key model parameters like soil properties, land use patterns, and how stormwater infrastructure performs. This process relies heavily on monitoring data collected from specific sites, as well as insights from related modeling studies.
Which model should I use for my Maryland watershed – WMOST, SWAT, or SWMM?
Choosing between WMOST, SWAT, or SWMM comes down to the specific needs of your watershed and what you aim to achieve.
- WMOST works best for urban areas where the focus is on optimizing policies and managing nutrients.
- SWAT is tailored for agricultural or rural environments, with an emphasis on hydrology and water quality.
- SWMM is the go-to option for detailed urban stormwater modeling and infrastructure planning.
By aligning your objectives with the strengths of each model, you can choose the most effective tool for your project.
Why do infiltration practices like trenches sometimes model poorly?
Infiltration methods, such as trenches, often face challenges in modeling because they rely heavily on local soil conditions, infiltration rates, and other site-specific factors. Accurately capturing these variables in models can be tricky, which frequently results in discrepancies between the predicted outcomes and actual performance.
Chat with Us